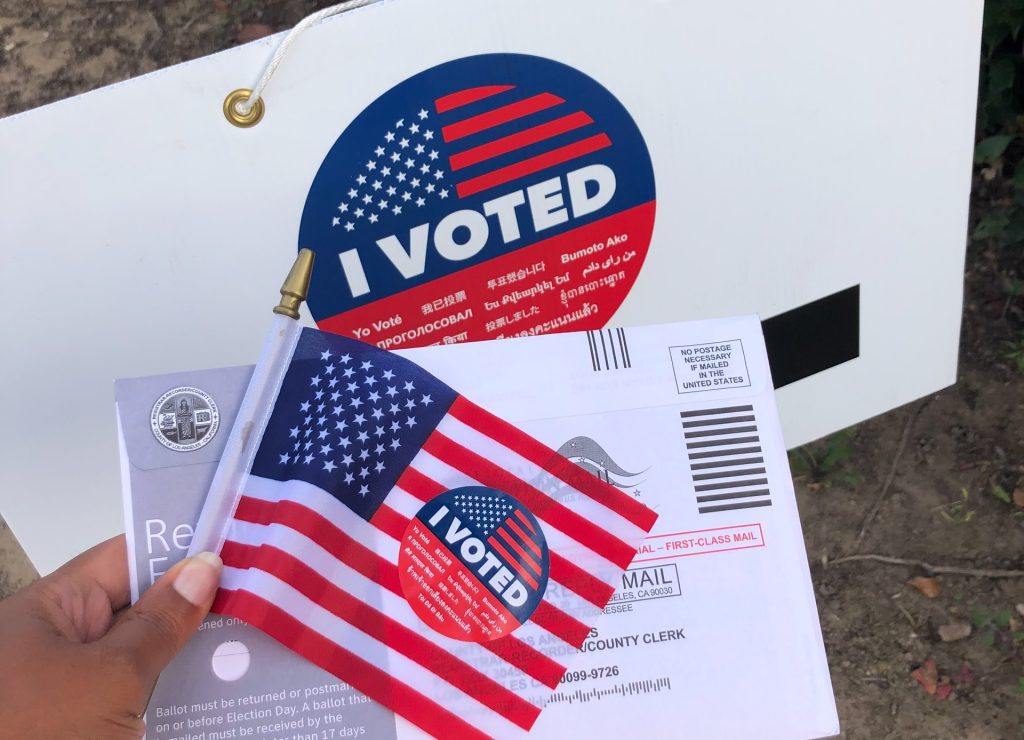
FILE PHOTO: Photo by Janine Robinson on Unsplash
LOGAN – The state of Utah once again has received high marks from personal financial website WalletHub, this time for its level of racial equality in civic engagement. The state ranked third behind fellow western states New Mexico and Wyoming, respectively. Four other western states cracked the top 10 on the list, including California (4th), Montana (5th), Arizona (6th) and Washington (10th). Idaho is ranked 12th on the list.
However, last December the site ranked Utah as the worst state in the country for women’s equality. Also, Stacker compared Utah’s voter demographics from the 2019 elections and found voter participation did not match Utah’s demographics. Of those who voted, 90.8% were White, 0.9% were Black or African American; whereas, Utah’s demographic make up (according to the U.S. Census Bureau) is 61.6% White and 12.4% Black or African American.
According to WalletHub, in order to determine which states have the most racial equality in civic engagement they compared 48 states (excluding Alaska and Hawaii) and the District of Columbia across five key metrics. Their data compares the difference between white and black Americans in areas like the share of single-parent households, the volunteer rate and voter registration.
Idaho scored first in the country with the lowest gap in single-parent households. Utah tied for first with other western states Colorado, New Mexico, Wyoming and Montana as the states with the lowest gap in share of veterans.
In 2020, voter turnout in Utah surpassed a previous high water mark that was set in 1964 (89.61%) with a record 90.09% of active Utah voters casting ballots in 2020. In Cache County, 92.28% of registered voters cast ballots. In Box Elder County, 91.69% cast ballots. According to Utah voter information that is publicly available, as of June 6, 2022 there are 1,674,955 active voters in Utah and 206,990 inactive voters for a combined total of 1,881,945 registered voters in the state.
According to the U.S. Census Bureau, Utah’s race and ethnicity makeup is as follows: White alone 61.6%; Black alone 12.4%; Hispanic 18.7%; Asian alone 6%; American Indian and Alaska Native alone 1.1%; Native Hawaiian and Other Pacific Islander alone 0.2%; Some Other Race alone 8.4%; Two or More Races 10.2%.
Each metric that was used to determine the rankings was graded on a 100-point scale, with a score of 100 representing the most equality. The level of equality was determined by subtracting the values attributed to white Americans and black Americans for a given metric, using only the most recent available data.
- Share of Single-Parent Households: Full Weight (~20.00 Points)
- Share of Adult Population on Parole: Full Weight (~20.00 Points)
- Share of Veterans: Full Weight (~20.00 Points)
- Volunteer Rate: Full Weight (~20.00 Points)
- Voter-Turnout Rate: Full Weight (~20.00 Points)
Note: This metric measures the rates for presidential elections.
If in some states black people scored as high as or better than white people on a given metric, all such states were awarded the maximum number of points.
Finally, they determined each state and the District’s weighted average across all metrics to calculate its total score and used the resulting scores to rank-order the states.
Data used to create this ranking were collected from of the U.S. Census Bureau, Bureau of Justice Statistics and Corporation for National and Community Service.
See where each state ranks with the interpretive map below:

